- Financial Results
- Proportion of Segments
- Energy Systems (Former Power Systems)
- Plants & Infrastructure / Logistics, Thermal & Drive Systems (Former Industry & Infrastructure)
- Aircraft, Defense & Space
- Classifications for reporting segments have been changed from this fiscal year.
"Energy Systems" corresponds to the former "Power Systems", and "Plants & Infrastructure Systems" and "Logistics, Thermal & Drive Systems" collectively correspond to the former "Industry & Infrastructure".
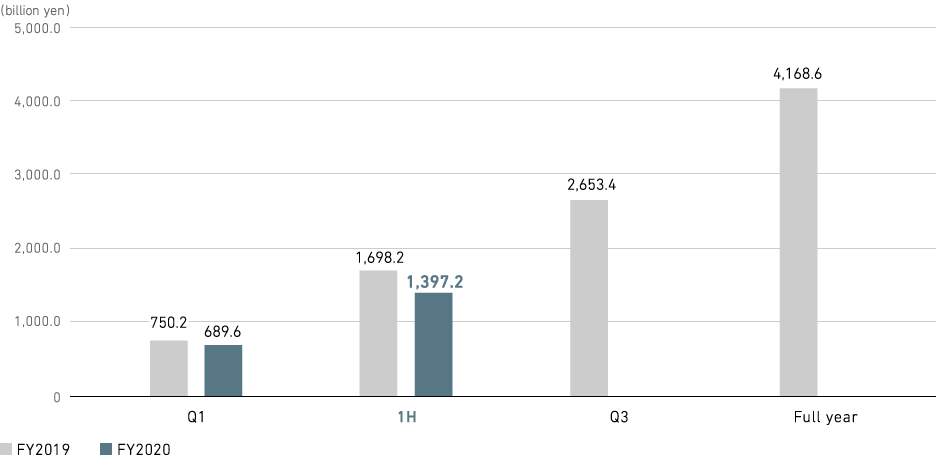
Order Intake (consolidated)

| Q1 | 1H | Q3 | Full year | |
|---|---|---|---|---|
| FY2020 | 689.6 billion yen | 1,397.2 billion yen | - | - |
| FY2019 | 750.2 billion yen | 1,698.2 billion yen | 2,653.4 billion yen | 4,168.6 billion yen |
Revenue (consolidated)

| Q1 | 1H | Q3 | Full year | |
|---|---|---|---|---|
| FY2020 | 778.0 billion yen | 1,658.6 billion yen | - | - |
| FY2019 | 919.3 billion yen | 1,877.6 billion yen | 2,856.5 billion yen | 4,041.3 billion yen |
Profit (loss) Attributable to Owners of Parent (consolidated)

| Q1 | 1H | Q3 | Full year | |
|---|---|---|---|---|
| FY2020 | -57.9 billion yen | -57.0 billion yen | - | - |
| FY2019 | 16.3 billion yen | 29.2 billion yen | 101.4 billion yen | 87.1 billion yen |
Investors
- Management Policy
- Financial Data
- IR Library
- Stock and Bond Information


