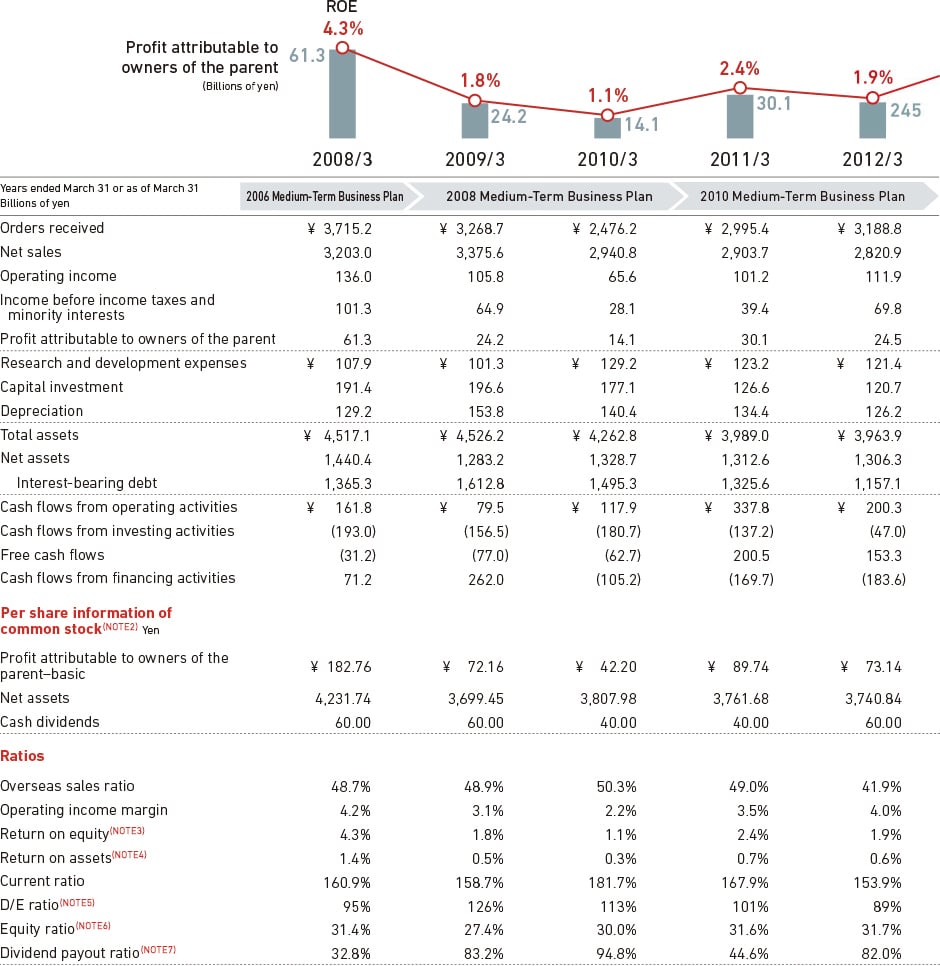
ELEVEN-YEAR FINANCIAL AND NON-FINANCIAL DATA
Years ended March 31
2006 Medium-Term Business Plan 〜 2010 Medium-Term Business Plan
2012 Medium-Term Business Plan 〜 2015 Medium-Term Business Plan
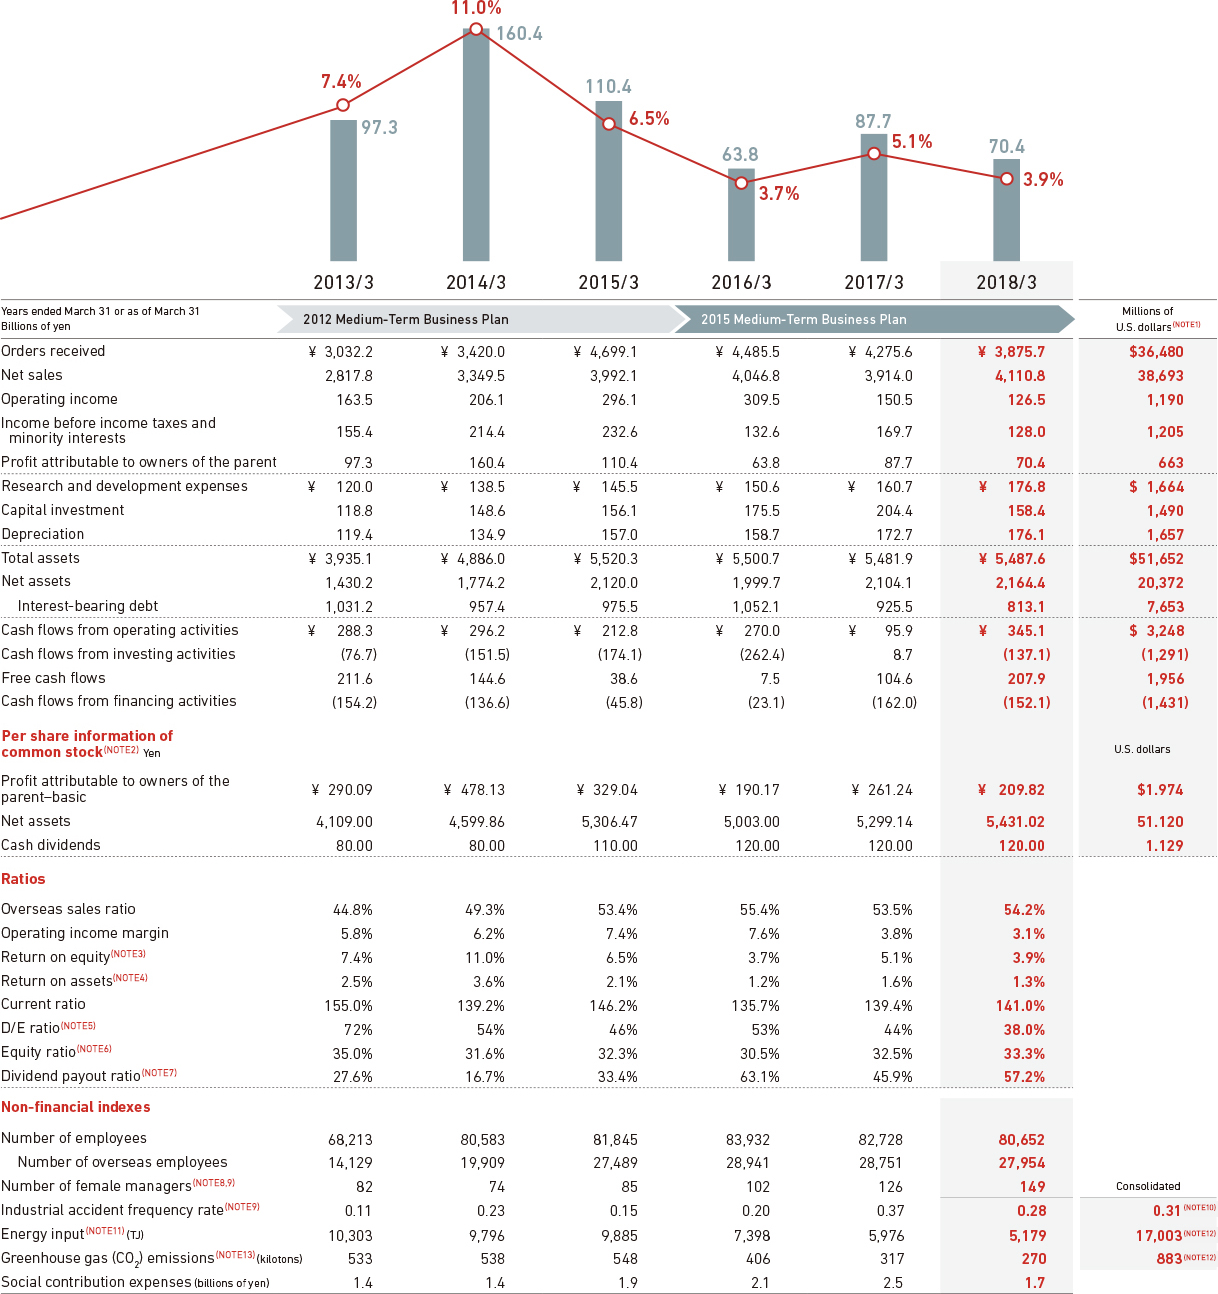
(NOTE1) U.S. dollar amounts in this report are translated from yen, for convenience only, at the rate of ¥106.24 = U.S. $1, the exchange rate prevailing at March 31, 2018.
(NOTE2) The Company conducted a 1-for-10 reverse stock split on common shares on October 1, 2017. The interim dividend for fiscal 2017 and data for fiscal 2016 and earlier is calculated as if the reverse stock split had been conducted at the beginning of the respective fiscal years. Calculations of per-share data are based on these assumptions.
(NOTE3) Return on equity = profit attributable to owners of the parent / (net assets – share subscription rights – non-controlling interests)
(NOTE4) Return on assets = profit attributable to owners of the parent / total assets
(NOTE5) D/E ratio = interest-bearing debt / net assets
(NOTE6) Equity ratio = (net assets – share subscription rights – non-controlling interests) / total assets
(NOTE7) Dividend payout ratio = dividends / profit attributable to owners of the parent
(NOTE8) People in positions of section manager or higher as of April 1 of each year
(NOTE9) In principle, MHI and Mitsubishi Hitachi Power Systems, Ltd on a non-consolidated basis.
(NOTE10) Includes MHI on a non-consolidated basis and 23 Group companies.
(NOTE11) Data is for MHI on a non-consolidated basis (production plants and offices). However, figures for fiscal 2014 include the Nagasaki, Takasago, and Yokohama plants of Mitsubishi Hitachi Power Systems, Ltd.
(NOTE12) Includes MHI on a non-consolidated basis and 152 Group companies.
(NOTE13) Data is for MHI on a non-consolidated basis. However, figures for fiscal 2014 include the Nagasaki, Takasago, and Yokohama plants of Mitsubishi Hitachi Power Systems, Ltd.