CFO'S MESSAGE

In pursuit of Triple One Proportion, we will undertake growth investments while maintaining financial soundness.
Stronger Financial Foundations through Focused Cash Flow Management
For many years MHI Group evaluated its operating status using the financial measures of orders received, net sales, and income. All those measures were indications of results, however, and they proved insufficient for detecting management issues or contributing to activities to enhance our corporate value. The outcome was entrenched stagnation of our business scale, sluggish income levels, and a severe financial situation.
As opposed to focusing on results, I believe we need to monitor free cash flow and quality of orders received—profit potential at the time of order receipt—as effective leading indicators. Particularly in the case of MHI, we know that free cash flow has a close correlation with our income levels two to three years into the future. Furthermore, free cash flow indicates the overall state not only of our profit/loss statements but simultaneously also of our balance sheets, and for that reason I think free cash flow is the management index most appropriate for evaluating our balance sheets—an area we previously paid relatively less attention to.
Reflecting these changes in perspective, starting around 2010 we made a significant shift toward management focused on cash flows.
Cash flow has two constituent components: one derived from income and the other generated from the balance sheets. Whereas the former is vulnerable to outside factors, the latter can be generated without external input.
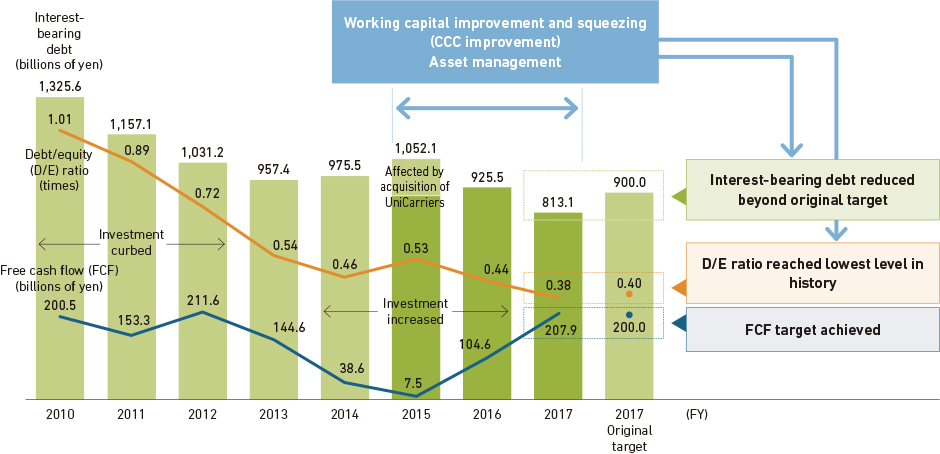
At the time of the financial crisis of 2008, I was serving as Senior General Manager of what was then the Finance Department, and I was gripped by the fear that we might run out of cash. From that experience I began speaking out on the importance of cash flow throughout the Company: to people in sales and procurement, in engineering, on the factory floor, everywhere. After that, our measures of working capital(NOTE) and cash conversion cycle improved markedly, and I think cash flow management has now taken firm root as our corporate culture. Improving cash flow not only increases the amount of freely available capital, it also facilitates investments and boosts risk resilience. Perhaps more significantly, as an abundant cash flow enables improvements in production efficiency and business terms, it also leads to greater business competitiveness.
Our shift to management focused on cash flow, together with various initiatives implemented starting with our 2012 Medium-Term Business Plan, enabled us to generate huge cash flows from fiscal 2010 onward. This abundant cash has funded appropriate cyclical investment into existing businesses, entirely met what are in a sense our “non-cyclical” capital needs—MRJ development costs, losses suffered in our cruise ship construction business, and construction costs relating to the South Africa project, for example—and also enabled us to reduce our interest-bearing debt. Dealing with these numerous issues, achieving financial soundness, and building up new cash reserves for tomorrow's growth qualifies as a major accomplishment.
(NOTE) Working capital = Trade receivables + Inventories – Trade payables – Advanced payment received on contracts (on a Companywide basis)
Key Financial Results
TOP (Triple One Proportion) Concept
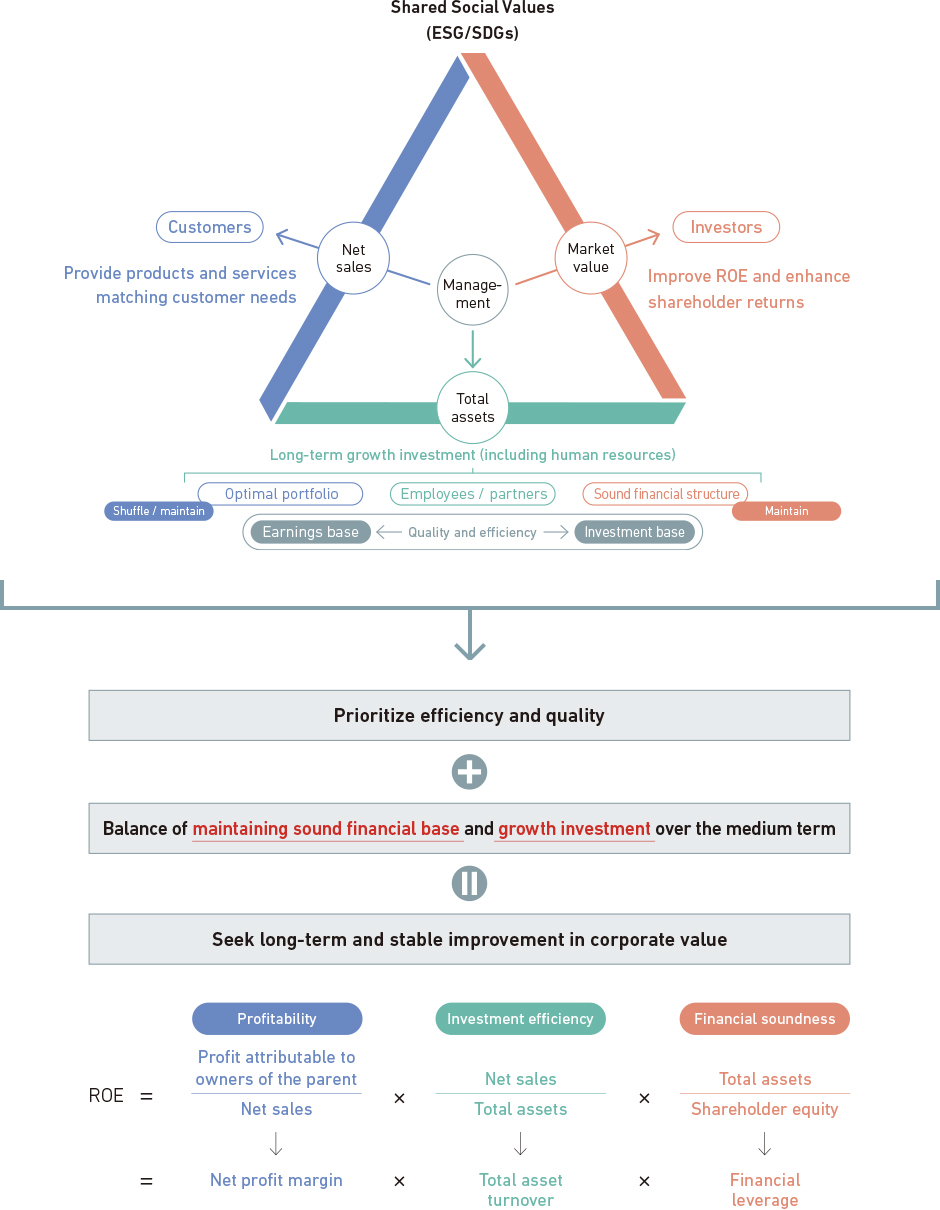
In the 2018 Medium-Term Business Plan launched this fiscal year, we adopted a comprehensive new key performance indicator (KPI) of our own invention to measure the operating status of MHI Group as a manufacturer. Known as “Triple One Proportion” (TOP), the concept's ideal is an equal balance—1 : 1 : 1—among three management factors: net sales (business scale), total assets, and market value.
The underlying basis of TOP is our balance sheets (total assets). The fundamental role of corporate management, I believe, is to strive to maximize output—business scale, corporate value, etc.—through skillful use of the balance sheets. In order to provide ever-better products and services, we require advanced technologies, the newest production facilities, an expansive sales network, and an efficient after-sale servicing structure, and these are all projected in the balance sheets.
The second constituent component of TOP, net sales (business scale), indicates how many business opportunities were created by the balance sheets and whether success was achieved in providing products to customers through market competition. By comparing business scale and the scale of the balance sheets, judgment can be rendered as to whether or not the balance sheets are efficiently generating business scale.
Regarding TOP's third component, market value, this is determined by a variety of factors. I believe the factor pulling the greatest weight is the steady income level generated through corporate activities.
Stated simply, if, for example, a net profit margin of 6% can be achieved with a business scale of ¥5 trillion, then profit attributable to owners of the parent is ¥300 billion. If MHI Group's capital cost ratio is 6%, then market value is ¥5 trillion divided by the 6% capital cost of ¥300 billion in profit attributable to owners of the parent (≒x16.7).
Viewing the three constituent components of TOP from a different angle, one can also say that balance sheets indicate efficiency and quality from management's perspective, business scale is indicative of satisfaction from the customers' perspective, and market value is corporate value from the investors' perspective. In short, when TOP is achieved, favorable levels of satisfaction are achieved from the respective viewpoints of management, customers, and investors.
At the end of fiscal 2017 MHI Group had net sales of ¥4.1 trillion, balance sheets in the amount of ¥5.5 trillion, and market value of ¥1.4 trillion. In the context of TOP, the balance sheets are thus generating about ¥1.4 trillion below target in business scale and market value is short by roughly ¥4.1 trillion. In order for these situations to improve and MHI Group to increase its value continuously, a suitable cash flow and sustained business scale to guarantee that flow are indispensable. Stated another way, if we continue to provide products of high quality and services that meet social needs, then MHI Group will be able to achieve a suitable cash flow to drive its growth and continuously raise its corporate value. Maintaining a balance between business and finances and seeking to maximize corporate value within this framework are the crucial points of our financial strategies in the 2018 Medium-Term Business Plan and onward.
Financial Strategies in the 2018 Medium-Term Business Plan
During the three years of the 2018 Medium-Term Business Plan, we are placing greater weight on “dynamic” capital allocation, including quick-impact growth investments, based on the financial foundations formed under preceding Business Plans and our newly earned cash flow.
Over the next several years we plan to invest an additional ¥200 billion into the MRJ project in the run-up to delivery of the first aircraft, currently scheduled for fiscal 2020; the end of the aircraft's development phase is now in sight. Construction work on the issue-laden thermal power plant project in South Africa is also thought to have peaked. In view of these improving situations, in the three years starting fiscal 2018 we plan to make dynamic investments totaling ¥960 billion, mainly directed into new businesses.
Among MHI Group's various businesses, those that account for 70% of total net sales have already achieved TOP, and their earning capacity is stable. Going forward, we seek to improve cash flow generating capacity and earning capacity by further strengthening these businesses and steadily addressing challenging businesses that require more attention.
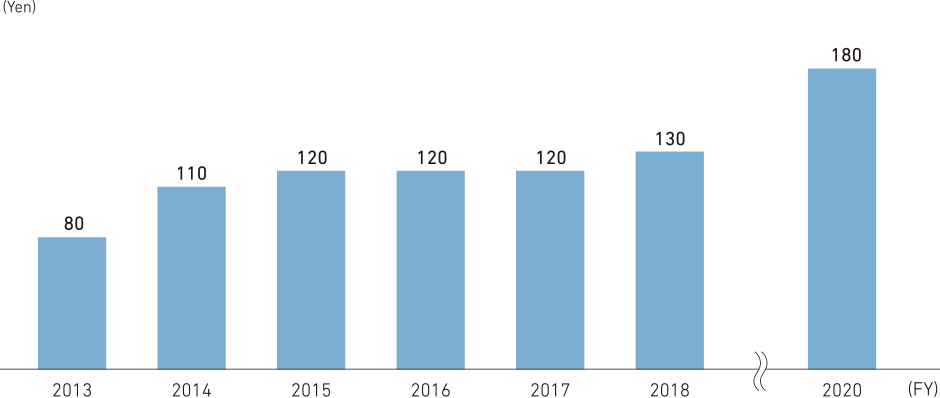
Our interest-bearing debt meanwhile is sufficiently low, and therefore rather than reducing debt, we aim to increase our shareholder returns. In fiscal 2018 we are planning to increase our dividend per share by ¥10, to ¥130, and in fiscal 2020 we hope to target ¥180.
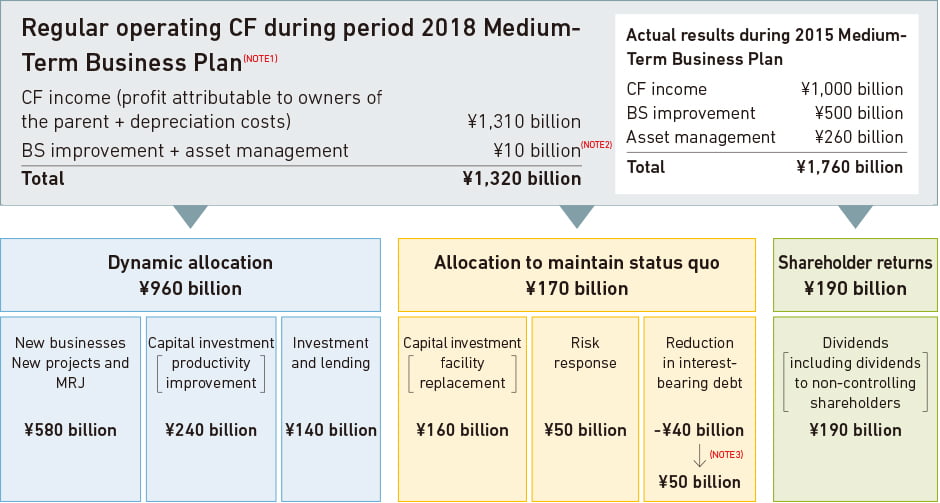
(NOTE1) Not including MRJ and the power plant project in South Africa
(NOTE2) BS improvement during 2015 Medium-Term Business Plan. Working capital to remain at current level during 2018 Medium-Term Business Plan despite the increase in business scale
(NOTE3) Includes appropriation (¥90 billion) of CF (cash in hand) acquired ahead of schedule in fiscal 2017 to reduce interest-bearing debt
To Our Shareholders and Investors
Among our shareholders and investors, some may be of the opinion that given the relative maturity of many of our businesses, MHI Group is retaining an excessive level of capital. However, a relatively flush amount of capital is necessary until we complete development of the MRJ and get the MRJ business, a major pillar of our future growth, on track. That said, our overriding aspiration is, to the extent possible, to simultaneously undertake MRJ investments and provide solid shareholder returns. As a standard measure, MHI Group has set a payout ratio of 30%—a figure that excludes impact from the MRJ. (When MRJ investment is factored in, the ratio is slightly higher.)
For MHI Group to achieve sustained growth, we have to create businesses that will become new pillars of strength 20 to 30 years into the future. In retrospect we have confronted a variety of difficulties through the years, but nonetheless our dividends have steadily increased—a manifestation of the steady improvement of our management capabilities.
At the same time, though, a gap still remains between our current market value and the level we aspire to. Achieving TOP is the path toward bridging that gap, and we will devise an array of management measures toward reaching that goal. Through robust dialogue with the market, we will continue to convey precisely what MHI Group is doing as we set out toward our next growth phase.
Dividend per share