Main Financial Data
SHARE


(Unit: billions of yen)
| FY2018 (IFRS) | FY2019 (IFRS) | FY2020 (IFRS) | FY2021 (IFRS) | FY2022 (IFRS) | |
|---|---|---|---|---|---|
| Orders received | 3,853.4 | 4,168.6 | 3,336.3 | 4,067.7 | 4,501.3 |
| Revenue | 4,078.3 | 4,041.3 | 3,699.9 | 3,860.2 | 4,202.7 |
| Profit from business activities | 200.5 | -29.5 | 54.0 | 160.2 | 193.3 |
| Profit (loss) before income taxes | 195.0 | -32.6 | 49.3 | 173.6 | 191.1 |
| Profit (loss) attributable to owners of parent | 110.2 | 87.1 | 40.6 | 113.5 | 130.4 |
| Total assets | 5,240.3 | 4,985.6 | 4,810.7 | 5,116.3 | 5,474.8 |
| Equity | 1,728.6 | 1,290.0 | 1,439.3 | 1,662.5 | 1,833.9 |
| Interest-bearing debt | 665.1 | 598.2 | 905.6 | 734.9 | 742.4 |
| Capital Expenditure | 147.3 | 161.5 | 125.5 | 122.8 | 150.7 |
| Depreciation | 124.9 | 144.6 | 139.2 | 132.1 | 137.8 |
| Cash flows from operating activities | 420.3 | 452.5 | -94.9 | 285.5 | 80.8 |
| Cash flows from investing activities | -161.8 | -239.5 | -182.2 | 16.3 | -45.5 |
| Free cash flows | 258.5 | 212.9 | -277.1 | 301.8 | 35.3 |
| Cash flows from financing activities | -271.0 | -204.4 | 221.7 | -255.7 | -18.9 |
Orders received

Revenue

Profit from business activities

Profit (loss) attributable to owners of parent

Total assets

Equity

Interest-bearing debt

Free cash flows

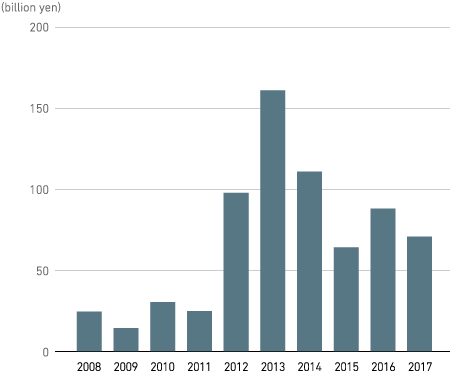
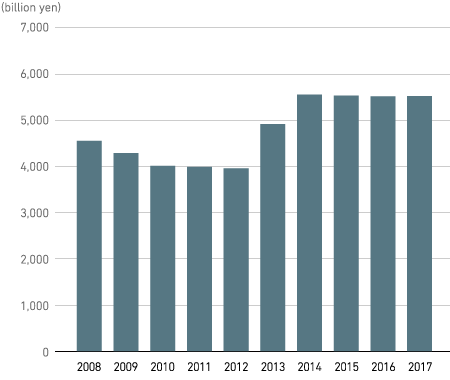
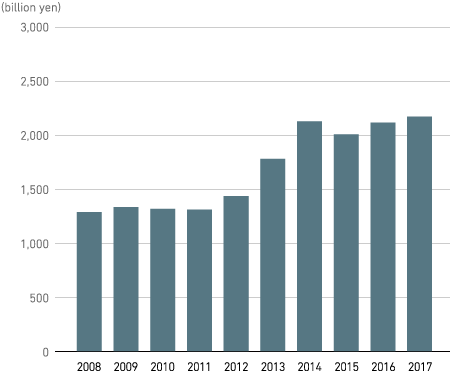
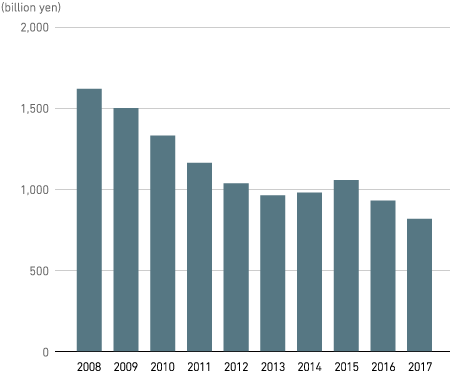
Main Financial Data (JGAAP) for FY 2008-2017
(Unit: billions of yen)
| FY2013 | FY2014 | FY2015 | FY2016 | FY2017 | |
|---|---|---|---|---|---|
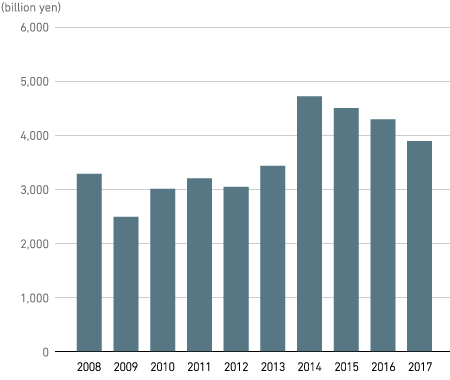
| Orders received | 3,420.0 | 4,699.1 | 4,485.5 | 4,275.6 | 3,875.7 |
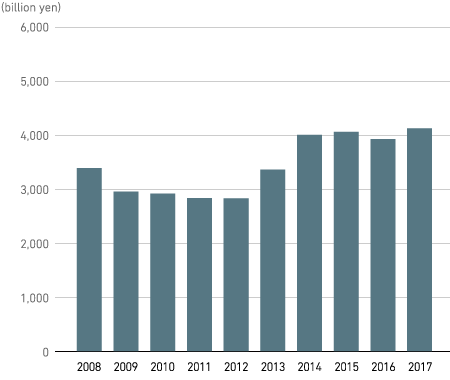
| Net sales | 3,349.5 | 3,992.1 | 4,046.8 | 3,914.0 | 4,110.8 |
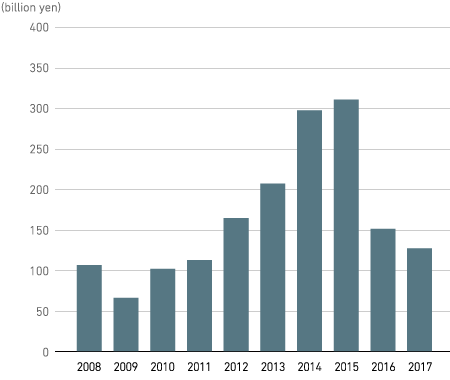
| Operating income (loss) | 206.1 | 296.1 | 309.5 | 150.5 | 126.5 |
| Ordinary income (loss) | 183.1 | 274.7 | 272.5 | 124.2 | 114.4 |
| Income (loss) before income taxes | 214.4 | 232.6 | 132.6 | 169.7 | 128.0 |
| Profit (loss) attributable to owners of parent | 160.4 | 110.4 | 63.8 | 87.7 | 70.4 |
| Total assets | 4,886.0 | 5,520.3 | 5,500.7 | 5,481.9 | 5,487.6 |
| Net assets | 1,774.2 | 2,120.0 | 1,999.7 | 2,107.2 | 2,164.4 |
| Debt with interest | 957.4 | 975.5 | 1,052.1 | 925.5 | 813.1 |
| Capital investment | 148.6 | 156.1 | 175.5 | 204.4 | 158.4 |
| Depreciation | 134.9 | 157.0 | 158.7 | 172.7 | 176.1 |
| Cash flows from operating activities | 296.2 | 212.8 | 270.0 | 95.9 | 345.1 |
| Cash flows from investing activities | -151.5 | -174.1 | -262.4 | 8.7 | -137.1 |
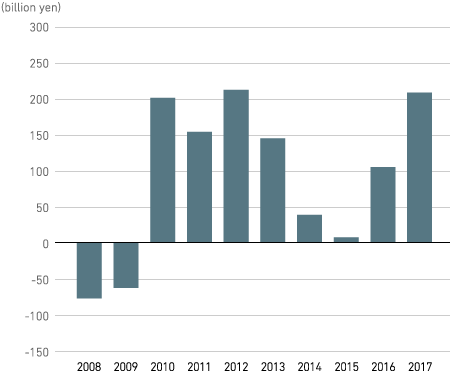
| Free cash flows | 144.6 | 38.6 | 7.5 | 104.6 | 207.9 |
| Cash flows from financing activities | -136.6 | -45.8 | -23.1 | -162.0 | -152.1 |
| FY2008 | FY2009 | FY2010 | FY2011 | FY2012 | |
| Orders received | 3,268.7 | 2,476.2 | 2,995.4 | 3,188.8 | 3,032.2 |
| Net sales | 3,375.6 | 2,940.8 | 2,903.7 | 2,820.9 | 2,817.8 |
| Operating income (loss) | 105.8 | 65.6 | 101.2 | 111.9 | 163.5 |
| Ordinary income (loss) | 75.3 | 24.0 | 68.1 | 86.1 | 149.0 |
| Income (loss) before income taxes | 64.9 | 28.1 | 39.4 | 69.8 | 155.4 |
| Profit (loss) attributable to owners of parent | 24.2 | 14.1 | 30.1 | 24.5 | 97.3 |
| Total assets | 4,526.2 | 4,262.8 | 3,989.0 | 3,963.9 | 3,935.1 |
| Net assets | 1,283.2 | 1,328.7 | 1,312.6 | 1,306.3 | 1,430.2 |
| Debt with interest | 1,612.8 | 1,495.3 | 1,325.6 | 1,157.1 | 1,031.2 |
| Capital investment | 196.6 | 177.1 | 126.6 | 120.7 | 118.8 |
| Depreciation | 153.8 | 140.4 | 134.4 | 126.2 | 119.4 |
| Cash flows from operating activities | 79.5 | 117.9 | 337.8 | 200.3 | 288.3 |
| Cash flows from investing activities | -156.5 | -180.7 | -137.2 | -47.0 | -76.7 |
| Free cash flows | -77.0 | -62.7 | 200.5 | 153.3 | 211.6 |
| Cash flows from financing activities | 262.0 | -105.2 | -169.7 | 183.6 | -154.2 |
Orders received
Net sales
Operating income (loss)
Profit (loss) attributable to owners of parent
Total assets
Net assets
Debt with interest
Free cash flows